搜尋本站文章

2018-12-01

Enabled SET XACT_ABORT ON in SSMS, 在 SSMS 啟用 XACT_ABORT


延續前一篇文章:BEGIN TRAN with XACT_ABORT

若需要以此 SSMS 為單元,所建立的 Connection,都要啟用 XACT_ABORT,可以在 SSMS 執行以下設定


影響範圍


  • 啟用後,僅套用在此 SSMS 新建立的 Connection,不影響 SQL Server。
  • 由此 SSMS 新建立的 Connection,即刻適用。但對既有的 Connection 則不受影響。

若有需要,可以關閉 SSMS,再度開啟 SSMS。


Enabled SET XACT_ABORT ON in SSMS, 
在 SSMS 啟用 XACT_ABORT


01. 在 SSMS ,點選上方工具選單,Tools ,選擇 Options。

02. 在 Options 視窗


  • 點選 Query Execution,SQL  Server,Advanced。
  • 或是,在 Search Options 方塊,輸入: XACT 關鍵字。


03. 在 Advanced \ Specify the advanced execution settings 對話方塊


  • 勾選: SET XACT_ABORT ON


-- figure 01_SSMS_SET_XACT_ABORT_ON


影響範圍


  • 啟用後,僅套用在此 SSMS 新發出的 Connection,不影響 SQL Server。
  • 由此 SSMS 發出的新 Connection,即刻適用。但對既有的 Connection 則不受影響。

若有需要,可以關閉 SSMS,再度開啟 SSMS。


Reference

BEGIN TRAN with XACT_ABORT
http://sharedderrick.blogspot.com/2018/11/begin-tran-with-xactabort.html

查詢是否有啟用 XACT_ABORT 選項
http://sharedderrick.blogspot.com/2008/09/xactabort.html

設定 user options 伺服器組態選項
https://docs.microsoft.com/zh-tw/sql/database-engine/configure-windows/configure-the-user-options-server-configuration-option?view=sql-server-2017

SET XACT_ABORT (Transact-SQL)
https://docs.microsoft.com/zh-tw/sql/t-sql/statements/set-xact-abort-transact-sql?view=sql-server-2017

@@TRANCOUNT (Transact-SQL)
https://docs.microsoft.com/zh-tw/sql/t-sql/functions/trancount-transact-sql?view=sql-server-2017

2018-11-27

BEGIN TRAN with XACT_ABORT


若需求是

  • 遇到執行階段的錯誤,希望系統能自動回復 Rollback 整個 交易 Transaction。
  • 則 請使用 BEGIN TRAN 並且設定 SET XACT_ABORT ON。


當 SET XACT_ABORT 是 ON 時,如果 Transact-SQL 陳述式產生執行階段錯誤,就會終止和回復整個交易。

  • 例如:資料表不存在、違反 外部索引鍵 等。


有啟用 SET XACT_ABORT ON,當遇到 執行階段錯誤時,系統自動回復 Rollback 目前交易,查詢 @@TRANCOUNT = 0。


BEGIN TRAN with enable XACT_ABORT


當 SET XACT_ABORT 是 ON 時,

  • 如果 Transact-SQL 陳述式產生執行階段錯誤,就會終止和回復整個交易。
  • 例如:資料表不存在、違反 外部索引鍵 等
  • SET XACT_ABORT 不會影響到如語法錯誤之類的編譯錯誤。


01. 僅使用 BEGIN TRAN,執行 Script:

  • 資料表 Products 存在,第 1 句 SELECT 執行成功,有回傳資料。
  • 但 SELECT 資料表 Products_XXX 不存在,執行時系統回傳 Error Message 208: Invalid object name。


問題:

  • 第 2 句 SELECT 執行失敗,但先前已經啟用 BEGIN TRAN,這會造成什麼影響呢?

-- figure 01_BEGIN TRAN without XACT_ABORT


02. 使用 @@TRANCOUNT ,檢視目前連線已經啟用 BEGIN TRAN 的數量。

  •  回傳 1,表示已經有 1 個 BEGIN TRAN 存在。
  • 若沒有 BEGIN TRAN,預設回傳 0。

-- figure 02_Have opened a transaction, @@TRANCOUNT = 1


03. 若嘗試去關閉該連線。

在 SSMS 產生警示的對話方塊,該連線有 未認可的交易(uncommitted transaction)。
點選 No,可以 退回 Rollback Transaction。

-- figure 03_Get_uncommitted_transaction


BEGIN TRAN with SET XACT_ABORT ON


當 SET XACT_ABORT 是 ON 時,

  • 如果 Transact-SQL 陳述式產生執行階段錯誤,就會終止和回復整個交易。
  • 例如:資料表不存在、違反 外部索引鍵 等
  • SET XACT_ABORT 不會影響到如語法錯誤之類的編譯錯誤。


01. 在新的連線上,使用 SET XACT_ABORT ON 與 BEGIN TRAN。

  • 資料表 Products 存在,第 1 句 SELECT 執行成功,有回傳資料。
  • 但 SELECT 資料表 Products_XXX 不存在,執行時系統回傳 Error Message 208: Invalid object name。

問題:

  • 先前已經使用 SET XACT_ABORT ON 與 BEGIN TRAN。其中,第 2 句 SELECT 因資料表 不存在 而執行失敗,這會造成什麼影響呢?

-- figure 11_Get_Error


02. 使用 @@TRANCOUNT ,檢視目前連線已經啟用 BEGIN TRAN 的數量。


  •  回傳 0,表示沒有任何 BEGIN TRAN 存在。
  • 若沒有 BEGIN TRAN,預設回傳 0。

這是因為當 SET XACT_ABORT 是 ON 時,
如果 Transact-SQL 陳述式產生執行階段錯誤,就會終止和回復整個交易。

-- figure 12_ @@TRANCOUNT = 0


03. 對比兩者的差異


  • 兩邊 SQL Script 執行後,在第 2 句 SELECT 資料表 Products_XXX 不存在,系統回傳 Error Message 208: Invalid object name。
  • 有啟用 SET XACT_ABORT ON,當遇到 執行階段錯誤時,系統自動回復 Rollback 目前交易,查詢 @@TRANCOUNT = 0。


-- figure 21_Compare


2018-10-29

Find out Statistics used to Execution Plan from Plan Cache - DBCC TRACEON(8666), 由 Plan Cache 取得 執行計畫 所使用的 統計值


啟用 TRACEON(8666) 後,在 該 Session 就可以:

  • 由 Plan Cache (Memory) 取得 Execution Plan 所使用的 Statistics
  • 由 Include Actual Execution Plan / Display Estimated Execution Plan ,取得 Execution Plan 所使用的 Statistics
  • 在 Execution Plan 上會額外提供 Internal Debugging Information(內部偵錯用訊息) ,這包含了 Statistics 細節資訊。

例如,可以取得:
StatName、ColName、ModCtr、RowCount、Threshold、Reason 等資訊。


此為 Undocumented Trace Flags: DBCC TRACEON(8666)
適用版本: SQL Server 2008 以上的環境


檢視 ModTrackingInfo 元素

  • StatName: _WA_Sys_00000003_014935CB
  • ColName: ContactName
  • ModCtr: 91
  • RowCount: 91
  • Threshold: 500
  • Reason: small table


Find out Statistics used to Execution Plan from Plan Cache - DBCC TRACEON(8666), 

由 Plan Cache 找出 執行計畫 所使用的 統計值 - - DBCC TRACEON(8666)


本文 以下介紹 2 種用法:

(1) 由 Plan Cache (Memory) 取得 Execution Plan 所使用的 Statistics - 
啟用 TRACEON(8666) ,並執行 sys.dm_exec_query_plan


用法:

  • 啟用 DBCC TRACEON(8666) 後,可以使用 sys.dm_exec_query_plan 由 Plan Cache ,取得 Query Optimizer 在 Execution Plan 所使用的 Statisitics。


功能:

  • 將 內部偵錯用訊息 存放於 Execution Plan 內,這包含了 Statistics 細節資訊。


若沒有啟用 DBCC TRACEON(8666) ,則 sys.dm_exec_query_plan 顯示為 NULL,沒有資料。


(2) 由 Include Actual Execution Plan / Display Estimated Execution Plan ,取得 Execution Plan 所使用的 Statistics
- 啟用 TRACEON(8666) 


用法:

  • 若搭配指定的 SQL Query,使用 Include Actual Execution Plan / Display Estimated Execution Plan,可以取得 Query Optimizer 在 Execution Plan 所使用的 Statistics。


功能:

  • 將 內部偵錯用訊息 存放於 Execution Plan 內,這包含了 Statistics 細節資訊。


(1) 由 Plan Cache (Memory) 取得 Execution Plan 所使用的 Statistics
啟用 TRACEON(8666) ,並執行 sys.dm_exec_query_plan

  • 用法: 啟用 DBCC TRACEON(8666) 後,可以使用 sys.dm_exec_query_plan 由 Plan Cache ,取得 Query Optimizer 在 Execution Plan 所使用的 Statisitics。
  • 功能: 將 內部偵錯用訊息 存放於 Execution Plan 內,這包含了 Statistics 細節資訊。
  • 若沒有啟用 DBCC TRACEON(8666) ,sys.dm_exec_query_plan 的 [Statistics] 顯示 NULL,沒有資料。

01. 使用 dm_db_stats_properties: 傳回 資料表 的所有 Statistics 屬性

  • Table: Customers, Orders
  • 已經存在 15 個 Statistics

-- figure 01_dm_db_stats_properties Returns properties of statistics for the specified database object


02. 執行 SQL Query。


  • 僅查詢單一資料表。
  • DBCC FREEPROCCACHE: 清除 Plan Cache,此為非必要,在本範例中,也僅是用於重置環境參數。


-- figure 02_Removes plan cache and Query Table with Auto Create Statistics


03. 啟用 TRACEON(8666) ,並執行 sys.dm_exec_query_plan

  • 用法: 啟用 DBCC TRACEON(8666) 後,可以使用 sys.dm_exec_query_plan 由 Plan Cache ,取得 Query Optimizer 在 Execution Plan 所使用的 Statisitics。
  • 功能: 將 內部偵錯用訊息 存放於 Execution Plan 內,這包含了 Statistics 細節資訊。
  • 若沒有啟用 DBCC TRACEON(8666) ,sys.dm_exec_query_plan 的 [Statistics] 顯示 NULL,沒有資料。


SQL Script 說明

  • 啟用 DBCC TRACEON(8666)
  • 執行 sys.dm_exec_query_plan,取得 Execution Plan  所使用的 Statistics
  • 關閉 DBCC TRACEOFF(8666)


-- DBCC TRACEON(8666) -- Find out Statistics used to Execution Plan from Plan Cache.
DBCC TRACEON(8666)

SELECT TOP 100 st.text [TSQL], DB_NAME(st.dbid) [DB], 
 qs.last_elapsed_time/1000000.0 [LastElapsedTime(sec)],
 qs.last_worker_time/1000000.0 [LastCPUTime(sec)],
 qs.last_logical_reads LastLogicalReads,
 qs.last_physical_reads LastPhysicalRead,
 qs.last_logical_writes LastlogicalWrites,
 qs.last_rows LastRows,
 cp.usecounts [ExecutionCount], cp.size_in_bytes/1024.0 [PlanSize(KB)],
 cp.cacheobjtype [CacheObject], cp.objtype [ObjType], qs.plan_generation_num [PlanRecompile],
 qp.query_plan.query('declare namespace ns="http://schemas.microsoft.com/sqlserver/2004/07/showplan";
 (/ns:ShowPlanXML/ns:BatchSequence/ns:Batch/ns:Statements/ns:StmtSimple/ns:QueryPlan/ns:ParameterList/ns:ColumnReference[@Column])') [ParameterList],
 qp.query_plan.query('declare namespace ns="http://schemas.microsoft.com/sqlserver/2004/07/showplan";
 (/ns:ShowPlanXML/ns:BatchSequence/ns:Batch/ns:Statements/ns:StmtSimple/ns:QueryPlan/ns:InternalInfo/ns:EnvColl/ns:Recompile)') [Statistics], 
 qp.query_plan [QueryPlan], cp.plan_handle, qs.last_execution_time, qs.creation_time
FROM sys.dm_exec_cached_plans cp INNER JOIN sys.dm_exec_query_stats qs
 ON cp.plan_handle = qs.plan_handle
 CROSS APPLY sys.dm_exec_sql_text(cp.plan_handle) st
 CROSS APPLY sys.dm_exec_query_plan(cp.plan_handle) qp
WHERE st.dbid = DB_ID('Northwind')
-- CHARINDEX ('Products', st.text) >0
-- st.text LIKE '%xxx%'
ORDER BY qs.last_execution_time DESC;

DBCC TRACEOFF(8666)
GO


-- figure 03_ DBCC TRACEON(8666) -- Find out Statistics used to Execution Plan from Plan Cache.


04. 檢視 回傳的結果集。

  • QueryPlan: 存放 Execution Plan。
  • Statistics: 存放 XML 格式的 Statistics。


-- figure 04_Get_Statistics_XML


05. 檢視 QueryPlan 內的 Execution Plan

  • 點選左邊的 SELECT operator,滑鼠右鍵,選擇 Properties。
  • 在右邊 Properties 窗格,展開 Internal Debugging Information
  • 展開 與 觀察 Recompile ModTrackingInfo

-- figure 05_SELECT_Properties_Internal Debugging Information


06. 在 ModTractkingInfo,展開 顯示 更多資訊關於 Statistics 資訊。

-- figure 06_ModTrackingInfo


07. 檢視 由 Plan Cache 取得的 Statistics 資訊


  • 以 XML 格式呈現的 Statistics。


-- figure 07_Execution_Plan_Statistics


08. 檢視 ModTrackingInfo 元素

  • StatName: _WA_Sys_00000003_014935CB
  • ColName: ContactName
  • ModCtr: 91
  • RowCount: 91
  • Threshold: 500
  • Reason: small table

-- figure 08_Statistics_ModTrackingInfo


09. 以 XML 格式 來檢視 Execution Plan


  • InternalInfo 元素


-- figure 09_XML


10. 以 XML 格式 來檢視 Execution Plan


  • Recompile 元素


-- figure 10_XML


11. 以 XML 格式 來檢視 Execution Plan


  • ModTrackingInfo 元素


-- figure 11_XML_ModTrackingInfo


(2) 由 Include Actual Execution Plan / Display Estimated Execution Plan ,取得 Execution Plan 所使用的 Statistics
-- 啟用 TRACEON(8666)


先前介紹的是由 Plan Cache (Memory) 取得 Execution Plan 所使用的 Statistics。

以下方式,則是應用於 Include Actual Execution Plan / Display Estimated Execution Plan ,取得 在 Execution Plan 所使用的 Statistics。


DBCC TRACEON(8666) -- Find out Statistics used to Execution Plan


  • 用法: 若搭配指定的 SQL Query,使用 Include Actual Execution Plan / Display Estimated Execution Plan,可以取得 Query Optimizer 在 Execution Plan 所使用的 Statistics。
  • 功能: 將 內部偵錯用訊息 存放於 Execution Plan 內,這包含了 Statistics 細節資訊。


01. 執行以下 SQL Query


  • 啟用 DBCC TRACEON(8666)
  • 使用 Include Actual Execution Plan / Display Estimated Execution Plan
  • 執行 SQL Query ,僅查詢 單一 資料表
  • 關閉 DBCC TRACEOFF(8666)


-- figure 21_Actual_Execution_Plan_DBCC TRACEON(8666)


02. 檢視 Execution Plan


  • 點選左邊的 SELECT operator,滑鼠右鍵,選擇 Properties
  • 在右邊 Properties 窗格,展開 Internal Debugging Information
  • 展開 與 觀察 Recompile ModTrackingInfo


可以看到 1 份 Statistics 資訊,檢視 ModTrackingInfo 元素

  • StatName: _WA_Sys_00000003_014935CB
  • ColName: ContactName
  • ModCtr: 91
  • RowCount: 91
  • Threshold: 500
  • Reason: small table


-- figure 22_Execution_Plan_SELECT_Properties_Internal Debugging Information


03. 執行複雜 SQL Query


  • 此 SQL Query,使用 Inner Join,查詢 2 張資料表,並使用 Where 條件式。
  • 觀察 Recompile ModTrackingInfo
  • 可以看到 當時 2 張資料表上的 全部 Statistics 資訊,約:15 個


在此案例 (Inner Join) 中,啟用 DBCC TRACEON(8666) 後,會取得 當時  參與資料表上的全部 Statistics 資訊。但仍可分析像是 條件式 Where、On 等 SQL statement,得知 當時 所使用的 Statistics。

-- figure 31_Display all statistics


04. 以 XML 格式 來檢視 Execution Plan


  • 觀察 Orders  資料表的 Statistics。


-- figure 32_XML_Orders


05. 以 XML 格式 來檢視 Execution Plan


  • 觀察 Orders 資料表的 Statistics。


-- figure 33_XML


06. 以 XML 格式 來檢視 Execution Plan


  • 觀察 Customers 資料表的 Statistics。


-- figure 34_XML_Customers


Sample Code

20181029_Find out Statistics_TRACEON_8666
https://drive.google.com/drive/folders/0B9PQZW3M2F40OTk3YjI2NTEtNjUxZS00MjNjLWFkYWItMzg4ZDhhMGIwMTZl?usp=sharing


Reference

Use Autostat (AUTO_UPDATE_STATISTICS), 認識 自動更新統計資料 (1)
http://sharedderrick.blogspot.com/2018/10/statistics-use-autostat.html

Use Autostat (AUTO_UPDATE_STATISTICS), 認識 自動更新統計資料 (2)
http://sharedderrick.blogspot.com/2018/10/use-autostat-autoupdatestatistics-2.html

Find out Statistics used to Execution Plan in SQL Server 2017, 找出 執行計畫 所使用的 統計值
http://sharedderrick.blogspot.com/2018/10/find-out-statistics-used-to-execution.html

2018-10-19

Find out Statistics used to Execution Plan in SQL Server 2017, 找出 執行計畫 所使用的 統計值


SQL Server 2017 強化 Execution Plan,增加 [OptimizerStatsUsage] 屬性,可提供 Query Optimizer 在此 Execution Plan 所使用的 Statistics。

無論是 Include Actual Execution Plan / Display Estimated Execution Plan,都可以使用 [OptimizerStatsUsage] 屬性。

經過測試: SQL Server 2017 版本,並且 COMPATIBILITY_LEVEL = 120 以上適用。


Find out Statistics used to Execution Plan in SQL Server 2017
找出 Execution Plan (執行計畫) 所使用的 Statistics (統計值)


SQL Server 2017 強化 Execution Plan,增加 [OptimizerStatsUsage] 屬性,可提供 Query Optimizer 在此 Execution Plan 所使用的 Statistics。

無論是 Include Actual Execution Plan / Display Estimated Execution Plan,都可以使用 [OptimizerStatsUsage] 屬性。

初步測試: SQL Server 2017 版本,並且 COMPATIBILITY_LEVEL = 120 以上適用。SQL Server 2014 (x.12)


01. 使用 dm_db_stats_properties: 傳回 資料表 的所有 Statistics 屬性
  • Table: Customers, Orders

-- figure 01_dm_db_stats_properties_Customers_Orders


02. 執行 SQL Query
  • 僅查詢單一資料表。

  • 無論是 Include Actual Execution Plan / Display Estimated Execution Plan,都可以使用 [OptimizerStatsUsage] 屬性。
  • 點選 左邊 最後一個 SELECT Operator,滑鼠 右鍵,選擇 Properties。

  • 自動產生 Statistics。
    • 依據預設值,有啟用資料庫選項:AUTO_CREATE_STATISTICS。
    • WHERE 條件式使用 Column: ContactName,Query Optimizer 將自動為其建立 Statistics。

-- figure 11_SQL_Server 2017_SELECT


03. 在 Properties 視窗,可以看到 [OptimizerStatsUsage] 區塊,使用到 1 個 Statistics,包含以下資訊:
  • Database: [Northwind]
  • LastUpdate: 2018-10-19T21:01:05.14
  • ModificationCount: 0
  • SamplingPercent: 100
  • Schema: dbo
  • Statistics: _WA_Sys_00000003_014935CB
  • Table: [Customers]


-- figure 12_SELECT_Properties_OptimizerStatsUsage


04. 檢視 Show Execution Plan XML
  • 觀察 OptimizerStatsUsage

-- figure 13_Show_Execution_Plan_XML


05. 執行 SQL Query
  • Table Join 2 個

    • 無論是 Include Actual Execution Plan / Display Estimated Execution Plan,都可以使用 [OptimizerStatsUsage] 屬性。
    • 點選 左邊 最後一個 SELECT Operator,滑鼠 右鍵,選擇 Properties。
-- figure 14_SQL_Server 2017_SELECT


06. 在 Properties 視窗,可以看到 [OptimizerStatsUsage] 區塊,使用到 3 個 Statistics,包含以下資訊:

[1]
  • Database: [Northwind]
  • LastUpdate: 2018-10-19T21:01:05.14
  • ModificationCount: 0
  • SamplingPercent: 100
  • Schema: dbo
  • Statistics: _WA_Sys_00000003_014935CB
  • Table: [Customers]

[2]
  • Database: [Northwind]
  • LastUpdate: 2008-09-13T13:06:45.8
  • ModificationCount: 0
  • SamplingPercent: 100
  • Schema: dbo
  • Statistics: [CustomerID]
  • Table: [Orders]

[3]
  • Database: [Northwind]
  • LastUpdate: 2008-09-13T13:06:45.77
  • ModificationCount: 0
  • SamplingPercent: 100
  • Schema: dbo
  • Statistics: [PK_Customers]
  • Table: [Customers]

-- figure 15_SELECT_Properties_OptimizerStatsUsage


07. 檢視 Show Execution Plan XML
  • 觀察 OptimizerStatsUsage

-- figure 16_Show_Execution_Plan_XML


08. 使用 SSMS 檢視 Index 與 Statistics

-- figure 17_SSMS_Statistics


Sample Code

20181019_Find out Statistics used to Execution Plan
https://drive.google.com/drive/folders/0B9PQZW3M2F40OTk3YjI2NTEtNjUxZS00MjNjLWFkYWItMzg4ZDhhMGIwMTZl?usp=sharing


Reference


Use Autostat (AUTO_UPDATE_STATISTICS), 認識 自動更新統計資料 (1)
http://sharedderrick.blogspot.com/2018/10/statistics-use-autostat.html

Use Autostat (AUTO_UPDATE_STATISTICS), 認識 自動更新統計資料 (2)
http://sharedderrick.blogspot.com/2018/10/use-autostat-autoupdatestatistics-2.html


2018-10-16

Use Autostat (AUTO_UPDATE_STATISTICS), 認識 自動更新統計資料 (2)


從 SQL Server 2016 (13.x) 開始,並且  COMPATIBILITY_LEVEL = 130 (資料庫相容性層級 ), 系統採用 Dynamic auto update statistics threshold (動態 自動更新統計資料閾值)
  • 使用降低、動態的統計資料更新臨界值。此臨界值會根據資料表中的資料列數目來做出調整。 
  • 這是以 1000 乘以目前資料表基數的平方根來計算。 
  • 例如
    • 如資料表包含 2 百萬個資料列,則計算結果是 SQRT(1000 * 2000000) = 44721.359。 
案例
  • 資料表有 10 萬筆資料列,若要達到自動更新統計資訊的 threshold
    • 需要有 10, 000 筆以上被異動。
    • 計算: SELECT SQRT (1000 * 100000) = 10000
  • 在具有 100,000 行的表中,觸發更新統計信息的閾值已降至 10 %。
  • 在一個包含 1,000,000 行的表中,它只需要大約 3.2 % 的異動,即可觸發自動更新統計信息。

透過這項變更,大型資料表上的統計資料會經常更新。 
不過,如果資料庫的相容性層級低於 130,便會套用 SQL Server 2014 (12.x) 臨界值。


追蹤旗標 2371

  • 在資料庫相容性層級 低於 130 之下,從 SQL Server 2008 R2 開始至 SQL Server 2014 (12.x)。或是,從 SQL Server 2016 (13.x) 至 SQL Server 2017,使用 追蹤旗標 2371 時, 
  • SQL Server 就會使用降低、動態的統計資料更新臨界值。此臨界值會根據資料表中的資料列數目來做出調整。
  • 對於較小的表格,閾值仍將是大約 20% 的百分比。
  • 當每個表超過 25,000 行時,動態規則才會啟動,並且隨著行數的增加,更改的記錄百分比變得越來越低。

更新 Statistics (統計值) 的 Threshold

SQL Server 2014 (12.x)SQL Server 2016 (13.x)
Threshold資料表基數的 20% + 500以 1000 乘以目前資料表基數的平方根
Example(100000 * 0.2) + 500 = 20,500SQRT (1000 * 100000) = 10,000


-- figure 53_Excel_Threshold


-- figure 54_Threshold_Chart


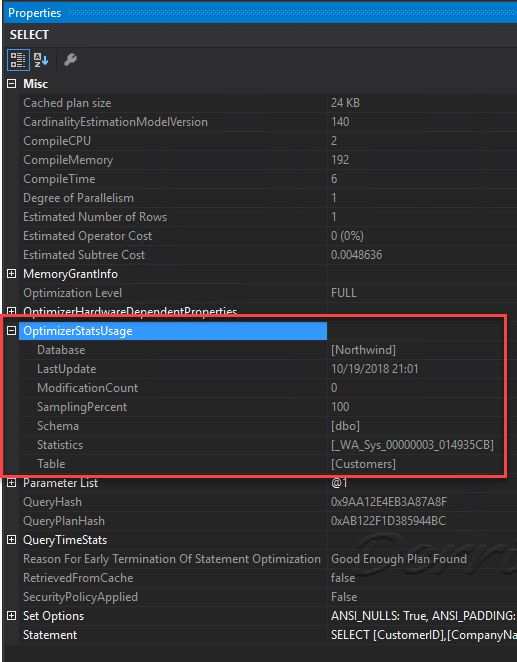
Statistics: Use Autostat (AUTO_UPDATE_STATISTICS ), 認識 自動更新統計資料 (2)


00. 依據預設值,資料庫屬性:Auto Create Statistics 與 Auto Update Statistics 已經啟用。

-- figure 51_Autostat


01. 檢查 COMPATIBILITY_LEVEL


  • 確認 COMPATIBILITY_LEVEL = 130
  • 將 固定 自動更新統計資料閾值 變更為 動態 自動更新統計資料閾值。 
  • SQL Server 會使用降低、動態的統計資料更新臨界值。此臨界值會根據資料表中的資料列數目來做出調整。 
  • 這是以 1000 乘以目前資料表基數的平方根 計算。 


 更新 Statistics 的 Threshold(臨界值)是:

  • 如果您的資料表包含 2 百萬個資料列,則計算結果是 SQRT(1000 * 2000000) = 44721.359。 


透過這項變更,大型資料表上的統計資料會經常更新。
不過,如果資料庫的相容性層級低於 130,便會套用 SQL Server 2014 (12.x) 臨界值。


追蹤旗標 2371

  • 將 固定 自動更新統計資料閾值 變更為 動態 自動更新統計資料閾值。 
  • 在資料庫相容性層級 低於 130 之下,從 SQL Server 2008 R2 開始至 SQL Server 2014 (12.x)。
  • 或是,從 SQL Server 2016 (13.x) 至 SQL Server 2017,使用追蹤旗標 2371 時, 
  • SQL Server 就會使用降低、動態的統計資料更新臨界值。此臨界值會根據資料表中的資料列數目來做出調整。
  • 當每個表超過 25,000 行時,動態規則才會啟動,並且隨著行數的增加,更改的記錄百分比變得越來越低。
  • 例如
    • 在具有 100,000 行的表中,觸發更新統計信息的閾值已降至 10%。
    • 在一個包含 1,000,000 行的表中,它只需要大約 3.2 % 的異動,即可觸發自動更新統計信息。

注意事項

  • 從 SQL Server 2016 (13.x) 開始及根據資料庫相容性層級 130,此行為由引擎控制,追蹤旗標 2371 沒有任何作用。

-- figure 01_COMPATIBILITY_LEVEL 130


02. 建立資料表 Statistics_100K


  • 建立資料表: Statistics_100K。
  • 建立 Primary Key 與 Clustered Index 在 column: rid。
  • 新增 10 萬筆資料列。


-- figure 02_Create Table Statistics_100K


03. 使用 dm_db_stats_properties: 傳回 資料表 的所有 Statistics 屬性


  • dm_db_stats_properties: SQL Server 2008 版本提供,可用於 傳回 資料表 的所有 統計資料 屬性。
  • 建立 Clustered Index 在 column: rid,系統自動一併建立 Statistics: PK_Statistics_100K_rid。
  • 但 Statistics 目前都是 NULL,尚未產生。


-- dm_db_stats_properties: Returns properties of statistics for the specified database object

SELECT sch.name [Schema], t.name [Table], c.name [Column], stat.stats_id, stat.name [Statistics], sp.last_updated, 
 sp.rows, sp.rows_sampled, sp.steps, sp.unfiltered_rows, stat.filter_definition, sp.modification_counter, 
 stat.auto_created, stat.user_created
FROM sys.stats stat CROSS APPLY sys.dm_db_stats_properties(stat.object_id, stat.stats_id) sp
 INNER JOIN sys.tables t ON t.object_id = stat.object_id
 INNER JOIN sys.stats_columns sc ON (sc.stats_id = sp.stats_id AND sp.object_id = sc.object_id)
 INNER JOIN sys.columns c ON (c.column_id = sc.column_id AND c.object_id = t.object_id)
 INNER JOIN sys.schemas sch ON t.schema_id = sch.schema_id
WHERE t.name = 'Statistics_100K';  
GO

-- figure 03_dm_db_stats_properties


04. 使用 SSMS 檢視 Index 與 Statistics。

-- figure 04_Primary_Key_Index_Statisitics


05. 自動產生 Statistics。


  • 依據預設值,有啟用資料庫選項:AUTO_CREATE_STATISTICS。
  • WHERE 條件式使用 Column: Cdata,Query Optimizer 將自動為其建立 Statistics。


AUTO_CREATE_STATISTICS


  • 查詢最佳化工具會視需要針對查詢述詞中的單一資料行建立統計資料,以便改善查詢計劃和查詢效能。 
  • 這些單一資料行統計資料是在查詢最佳化工具編譯查詢時所建立的。 
  • 它只會針對尚未成為現有統計資料物件之第一個資料行的資料行建立單一資料行統計資料。
  • 預設值是 ON。


-- figure 05_Auto Create Statistics_ Cdata column


06. 檢查 資料表上的 Statistics。

自動建立 Statistics: _WA_Sys_00000003_55DFB4D9

  • Column: Cdata
  • rows: 100000
  • rows_sampled: 89782
  • steps: 154
  • unfiltered_rows: 100000
  • modification_counter: 0
  • auto_created: 1


注意:
Statistics: PK_Statistics_100K_rid 內容值尚未產生,仍是 NULL

-- figure 06_dm_db_stats_properties


07. 使用 SSMS 檢視 Index 與 Statistics。


  • 已經新增第 2 個 Statistics: _WA_Sys_00000003_55DFB4D9


-- figure 07_SSMS_Statistics


08. 檢視 Statistics 的 Details 頁籤。


  • Statistics: PK_Statistics_100K_rid 內容值尚未產生,仍是 NULL


-- figure 08_Statistics_Detail_NULL


09. 檢視 Statistics 的 Details 頁籤。
  • Statistics: _WA_Sys_00000003_55DFB4D9

-- figure 09_Auto_Create_Statistics_Detail_Data


10. 使用 DBCC SHOW_STATISTICS 與 WITH STAT_HEADER

  • DBCC SHOW_STATISTICS 可檢視指定 Index, Statistics, Column 的統計資訊。
  • WITH STAT_HEADER,僅檢視 STAT_HEADER。
  • 與 dm_db_stats_properties 結果相同。

-- figure 10_DBCC SHOW_STATISTICS_WITH STAT_HEADER


11. 建立 Create NonClustered Index on [TransactionID]


-- figure 11_Create NonClustered Index on [TransactionID]


12. 檢視 Statistics:

  • 產生第 3 個 statistics。
  • 建立 Index,系統自動建立對應的 Statistics: IX_Statistics_100K_TransactionID。


Statistics: IX_Statistics_100K_TransactionID

  • Column: TransactionID
  • rows: 100000
  • rows_sampled:100000
  • steps:2
  • unfiltered_rows: 100000
  • modification_counter: 0
  • auto_created: 0


注意:

  • PK_Statistics_100K_rid 尚未產生 Statistics


-- figure 12_建立 Index_系統自動建立對應的 Statistics


13. 使用 SSMS 檢視 Index 與 Statistics。

  • 已經新增第 3 個 Statistics: IX_Statistics_100K_TransactionID


-- figure 13_Index_Statistics


14. 使用 DBCC SHOW_STATISTICS 與 WITH STAT_HEADER

  • 檢視 指定 Statistics: IX_Statistics_100K_TransactionID 的統計資訊


-- figure 14_DBCC SHOW_STATISTICS_WITH STAT_HEADER


Dynamic auto update statistics threshold 動態 自動更新統計資料閾值


認識 AUTO_UPDATE_STATISTICS 自動更新統計資料


  • 從 SQL Server 2016 (13.x) 開始,並 在資料庫相容性層級 130, 
  • 採用 Dynamic auto update statistics threshold(動態 自動更新統計資料閾值)
  • SQL Server 會使用降低、動態的統計資料更新臨界值。此臨界值會根據資料表中的資料列數目來做出調整。 
  • 這是以 1000 乘以目前資料表基數的平方根來計算。 

  • 例如,如果您的資料表包含 2 百萬個資料列,則計算結果是 SQRT(1000 * 2000000) = 44721.359。 

透過這項變更,大型資料表上的統計資料會經常更新。 
不過,如果資料庫的相容性層級低於 130,便會套用 SQL Server 2014 (12.x) 臨界值。


追蹤旗標 2371

  • 在資料庫相容性層級 低於 130 之下,從 SQL Server 2008 R2 開始至 SQL Server 2014 (12.x)。
  • 或是,從 SQL Server 2016 (13.x) 至 SQL Server 2017,使用追蹤旗標 2371 時, 
  • SQL Server 就會使用降低、動態的統計資料更新臨界值。此臨界值會根據資料表中的資料列數目來做出調整。

對於較小的表格,閾值仍將是大約 20% 的百分比。

當每個表超過 25,000 行時,動態規則才會啟動,並且隨著行數的增加,更改的記錄百分比變得越來越低。

例如
  • 在具有 100,000 行的表中,觸發更新統計信息的閾值已降至 10 %。
  • 在一個包含 1,000,000 行的表中,它只需要大約 3.2 % 的異動,即可觸發自動更新統計信息。


以本案例來看:

  • 資料表有 10 萬筆資料列,若要達到自動更新統計資訊的 threshold
  • 需要有 10, 000 筆以上被異動。
  • 計算: SELECT SQRT (1000 * 100000) = 10000

-- figure 52_Threshold


01. 本次案例,所使用的 SQL Query:

  • 資料表有 10 萬筆,回傳 10,310 筆。
  • Clustered Index Scan, Return 10,310 rows
  • TransactionID < 110311
  • Execution Plan: Missing Index

-- figure 21_常用的 Query 與 條件式


02. 有 Missing Index

-- figure 22_Missing_Index


檢視 Execution Plan


  • Cluster Index Scan
  • Reads: 1,289
  • Est Rows: 10,310
  • Actual Rows: 10,310


-- figure 23_Plan_Explorer


03. 刪除資料

  • 刪除 10,300 筆。
  • 已達到 更新 Statistics 的 threshold(臨界值)


SQL Server 2016(13.x) 版本,改為以 1000 乘以目前資料表基數的平方根來計算
  • This is calculated as the square root of the product of 1000 and the current table cardinality. 
  • SELECT SQRT (1000 * 100000) = 10000
  • TransactionID < 110301
  • Return 10,300 rows

-- figure 24_Modify Data to over threshold_SQRT


04. 檢視 Statistics:

超過 臨界值,但 Statistics 仍未改變 !


  • Statistics: IX_Statistics_100K_TransactionID
  • Column: TransactionID
  • rows: 100000
  • rows_sampled:100000
  • steps:2
  • unfiltered_rows: 100000
  • modification_counter: 10300
  • auto_created: 0
  • Total: 89,700 rows: SELECT 100000 - 10300 -- 89700


-- figure 25_dm_db_stats_properties_超過 臨界值,但 Statistics 仍未改變


使用 使用 DBCC SHOW_STATISTICS 與 WITH STAT_HEADER

-- figure 26_DBCC SHOW_STATISTICS_WITH STAT_HEADER


05. 再度執行 SQL Query


何時自動更新 AUTO_UPDATE_STATISTICS ?


  • 開啟自動更新統計資料選項 AUTO_UPDATE_STATISTICS 時,Query Optimizer 會判斷 statistics 何時過期,然後在查詢使用 statistics 時加以更新。
  • 在編譯查詢及執行快取 query plan 之前,Query Optimizer 會檢查是否有過期的 statistics 。 
  • 在編譯查詢之前,Query Optimizer 會使用查詢述詞中的資料行、資料表和索引檢視表來判斷哪些 statistics 可能已過期。 
  • 在執行快取 query plan 之前, Database Engine 會確認 query plan 是否參考最新的 statistics。


換言之:

  • statistics 過期後,要等到下次執行 Query(SIUD), 查詢 statistics 時,一併更新 statistics。
  • 如果 statistics 已過期,Query Optimizer 就會先等候並執行更新 statistics,然後再 compile 並執行查詢。


-- figure 31_何時更新 statistics_下次執行 Query(SIUD)


改為使用 Index Seek

-- figure 32_何時更新 statistics_下次執行 Query(SIUD)


檢視 Execution Plan

  • Index Seek
  • Reads: 33
  • Est Rows: 10
  • Actual Rows: 10


-- figure 33_Plan_Explorer
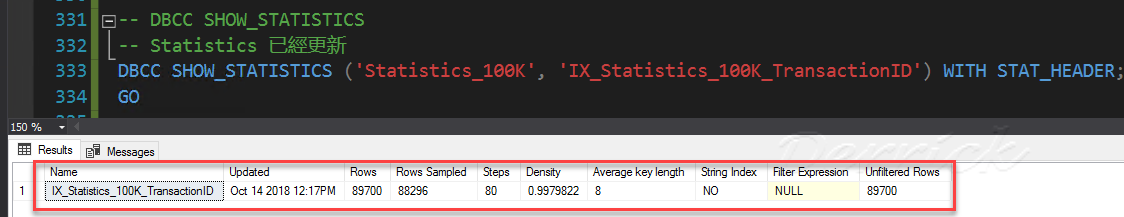


06. 檢視 Statistics

Statistics 已經更新
modification_counter: 0

(1) Statistics: IX_Statistics_100K_TransactionID
  • Column: TransactionID
  • rows: 89700
  • rows_sampled:88296
  • steps:80
  • unfiltered_rows: 89700
  • modification_counter: 0
  • auto_created: 0

(2) Statistics: PK_Statistics_100K_rid 尚未產生 Statistics

(3) _WA_Sys_00000003_55DFB4D9 仍是未更新

-- figure 34_dm_db_stats_properties


07. 使用 DBCC SHOW_STATISTICS 與 WITH STAT_HEADER


  • 檢視 指定 Statistics: IX_Statistics_100K_TransactionID 的統計資訊


-- figure 35_DBCC SHOW_STATISTICS_WITH STAT_HEADER


Statistics 更新前後的比較

BeforeAfter
IndexClustered Index ScanIndex Seek
Read1,28933
Est Rows10,31010


更新過的 Statistics,能夠反映實際的資料特性,幫助 Query Optimizer 選擇合適的 Index。
  • 若以 Read IO 來看,更新 Statistics 後,幫助 Query Optimizer 選擇合適的 Index
  • 效能提升:97.44 %。

SELECT ABS(33-1289)/1289.0 * 100 -- 97.439800


Sample Code

20181011_Use Autostat (AUTO_UPDATE_STATISTICS)
https://drive.google.com/drive/folders/0B9PQZW3M2F40OTk3YjI2NTEtNjUxZS00MjNjLWFkYWItMzg4ZDhhMGIwMTZl?usp=sharing


Reference

Use Autostat (AUTO_UPDATE_STATISTICS), 認識 自動更新統計資料 (1)
http://sharedderrick.blogspot.com/2018/10/statistics-use-autostat.html